

* Now tracking water radiation levels! *
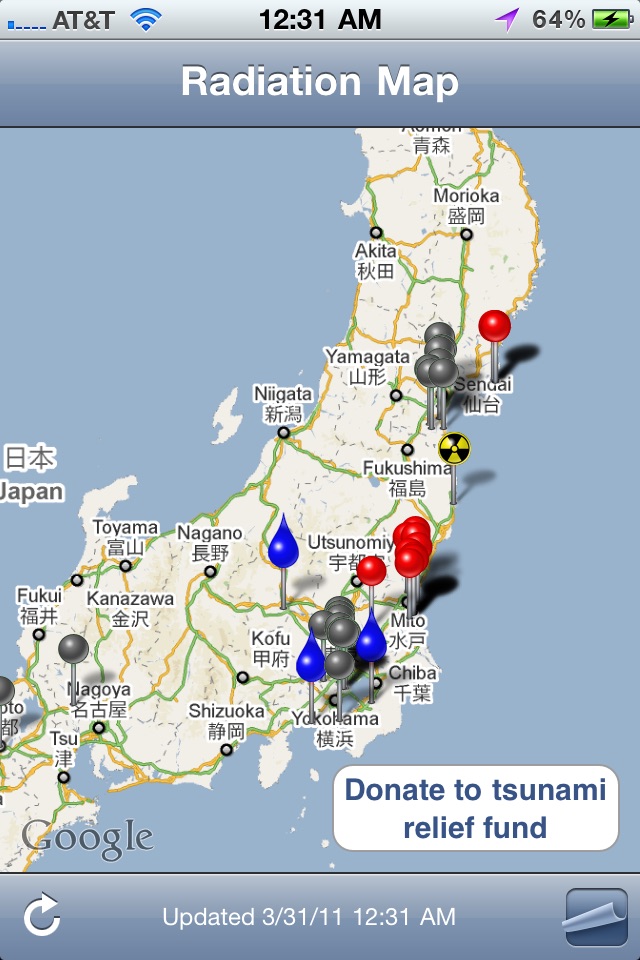
Japan Radiation Map tracks geiger counter readings in Japan to display current radiation levels, in response to the Fukushima power plant accident. Higher than normal readings (above .114 μSv/hour) are highlighted in red.
Data is reported by various private and public institutions. This application is for informative/educational purposes only, and downloaded data is not guaranteed to be accurate.